Projects
MSDA Capstone Project
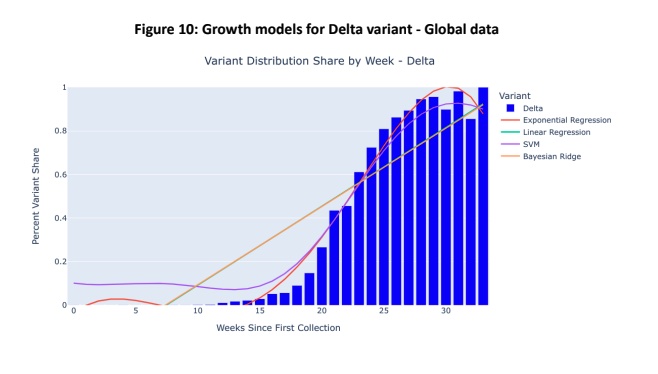
Here is my grad school capstone project from the UTC Master's in Data Science and Analytics program. My project focused on using machine learning to model growth trends of different COVID-19 variants. I created models using Python to visualize how unique strains of COVID spread in different parts of the world, and measure the differences and similarities between their patterns. Here’s a link to the final project paper. I did this data analysis in python, mostly using pandas, and used plotly for visualizations. Here are the notebooks.
Fire Risk Model
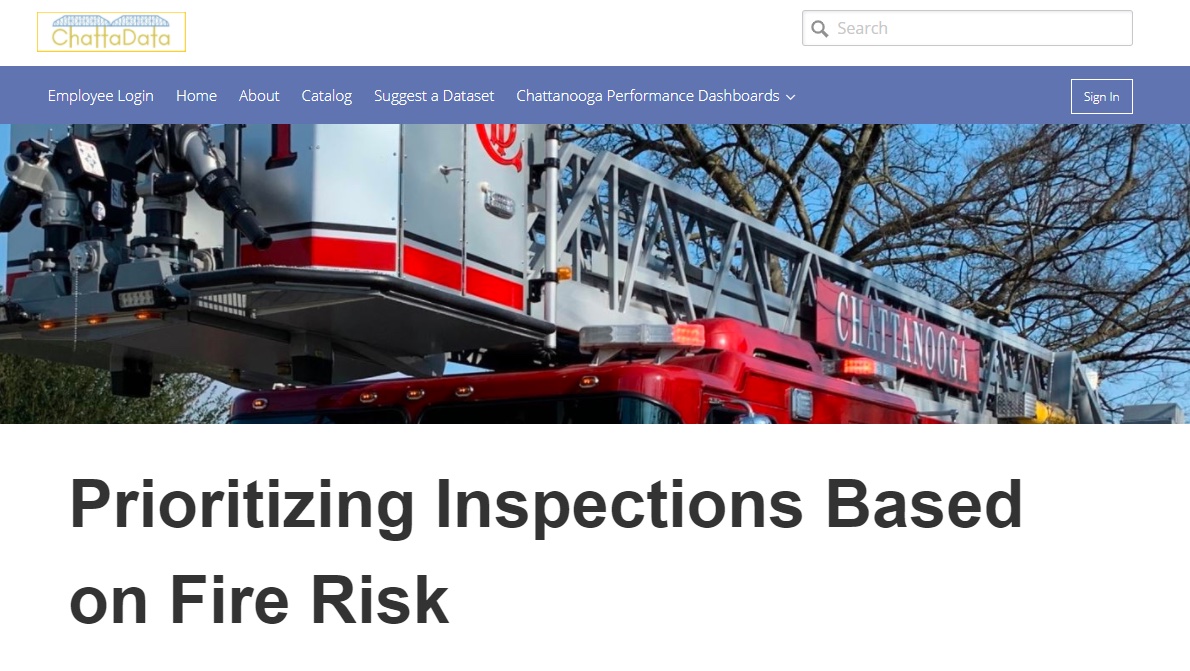
I worked on this project as a part of our Chattalytics program in the Performance Management and Open Data Office in the city. The goal was to develop a decision support tool to help prioritize fire inspections done by the Chattanooga Fire Department. To do this, I developed a machine learning model based on previous fire calls and parcel attributes. I also combined this with non predictive variables to add more context to the tool and better assist the decision making of the fire department. For more information check out the write up done by our office or the story done by local media.
Analyzing air quality with Hadoop and Spark
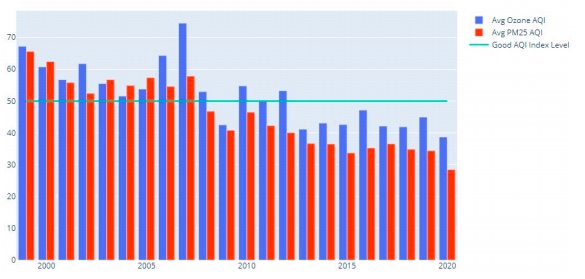
This is a project I worked on for a class focused on analyzing big data using Hadoop. Chattanooga historically had poor air quality, and I wanted to see how air quality had changed over time in the region. To do this, I used the EPA’s Air Quality System API to download the data. I then used Hive, Spark, and Hadoop to analyze data. To help answer and explain the project questions I used Plotly for data visualization. Here’s a link to the project paper I wrote for more information on the project.
Data Health Dashboard
I used the dashboard here to track my daily work and make sure that data is successfully flowing into the city’s data warehouse. The section I checked everyday is the job log timeline. Workflows are used to update datasets nightly, and these visuals display how many workflows were successful each day or each month . I started with the city in November 2018 and left my role there in July 2021.